
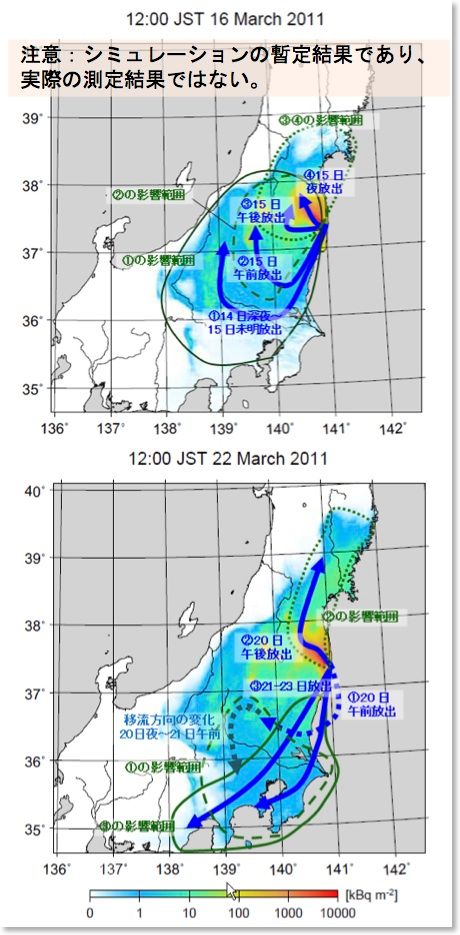
Fig. 1 The estimation of the main routes of radioactive materials released into the atmosphere during the early stage of the Fukushima Dai-ichi NPP accident (modified from the original of the figure published in the Asahi Shimbun on 11 Aug. 2011).
(Top pane) Estimated dispersion routes of radioactivity released for each period in 15 Mar. 2011 (arrows) and area of the deposition (enclosed with curves). Color contour shows calculated cumulative deposition of cesium-137 from 12 Mar. to the noon of 16 Mar. (JST). The input data of release rate is based on Chino et al. (2011), with our modification.
(Bottom pane) For the radioactivity released by 23 Mar. 2011. The color contour is for cumulative cesium-137 deposition from 12 Mar. to 22 Mar. 2011.
>> back