Subject:
Elaboration of Estimation Methods of Atmospheric Transport Phenomena by Using Radon Isotopes and Their Decay Products
Much of airborne materials in ambient air is transported from a distant by “wind.” Some of them travel from thousands-kilometer distant source, such as PM2.5 and yellow sand storm from the continent to Japan. Other pollutants, greenhouse gases and artificial radioactive materials released into the atmosphere are also transported by wind, that is, atmospheric transport including advection and diffusion. During atmospheric transport, most of airborne materials change their characteristics complicatedly by physical, chemical and sometimes biological processes, such as condensation, coagulation, dissolution and photochemical reactions, under a variety of conditions. To understand and predict behavior of such various and variable materials in the atmosphere, it is essential to understand atmospheric transport phenomena as the basis of various processes.
“Radon” (222Rn) and “thoron” (220Rn) are naturally occurring radioactive inert gases, which are exhaled from soil and building materials and then come into the atmosphere. Because of their simple generation and removal processes in comparison with other airborne materials, they are advantageous to analyze atmospheric transport by using them as tracers. Especially, radon has a half-life of 3.8 days that make it a good representative of atmospheric transport with a scale of thousands kilometers, since, after travel around the earth by global atmospheric circulation, atmospheric radon has almost decayed out and disappeared. By using spacial and temporal variation in atmospheric radon concentration, we have elaborated our methods of estimation of atmospheric transport phenomena.
1. Numerical Atmospheric Transport Models
Using advantages of radon, we have developed and improved numerical models that aim to reproducing and/or predicting atmospheric transport phenomena in various sizes (local, regional or hemispheric) of calculation domains. Comparing calculations with observations of real radon concentrations measured continuously (see Section 2 in this page), the numerical models are checked their accuracy of reproducing real atmospheric transport. For those calculations, information of spacial distribution of radon flux with temporal variation is necessary as input data, and we also estimate it (see Section 3).
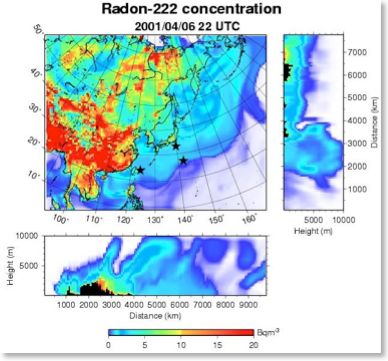
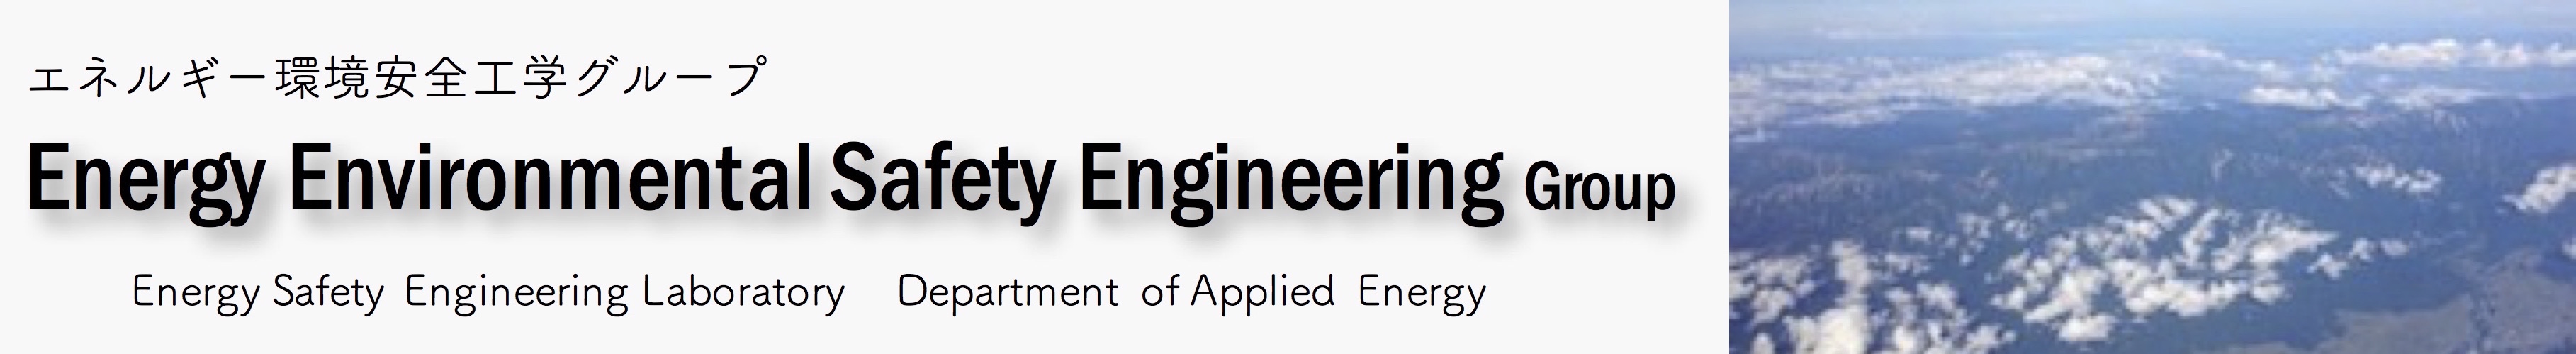
Fig. 1 Calculation of horizontal distribution of atmospheric radon concentration in East Asia. The transportation of continental radon to NW pacific ocean can be seen.
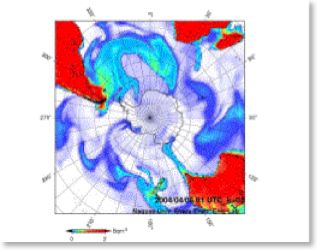
Fig. 2 Calculation of horizontal distribution of atmospheric radon concentration around Antarctica.
2. Observation
We have carried out continuous observation of atmospheric radon concentration at many locations in East Asia for different periods, as shown in Fig. 3. Seasonally, radon concentration in East Asia and northwestern Pacific Ocean have maximum in winter and minimum in summer. It is because of the fact that atmospheric radon is supplied mainly from the ground but less from sea surface and the characteristic of regional atmospheric transport that this region is covered with continental air mass in winter and by maritime air mass in summer. Passage of a cold front from the continent to the ocean also sharply rises radon concentration.
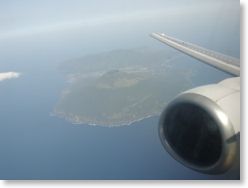
Fig. 3 Locations of the continuous observation of radon concentration and a photo of Hachijo-jima Island.
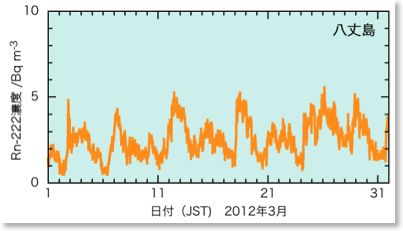
Fig. 4 Observed variation in radon concentration in Hachijo-jima Island for Mar. 2012. In spring and autumn, several-day-cyclic variations are frequently observed.
3. Estimation of Radon Flux Distribution
(1) Physical model
Study on physics of generation and transportation of radon in soil leads to development of technique to restrict radon exhalation from the ground and analysis of transport of other gases in soil. Combatting it with climatic and weather data, global distribution of radon emission rate (flux density) is enabled to be estimated.
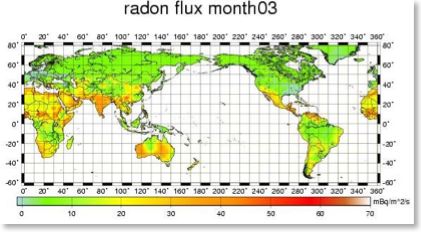
Fig. 5 Estimated global distribution of radon flux density by our physical model.
(2) Inverse analysis with observation and numerical transport model of atmospheric radon
Which distribution of radon emission can most accurately reproduce observed radon concentration variation by the numerical atmospheric transport model? By “inverse analysis,” the most likely distribution of radon emission rate is studied.
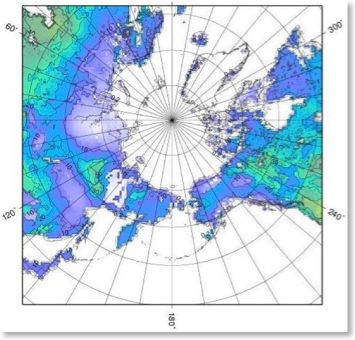
FIg. 6 The Result of inverse analysis of boreal radon flux distribution.
>> back